CFD Visualisation with IRIS Explorer 3.5
by David Knight, NAG Limited
 Many of the new features that have been added to IRIS Explorer (External) in Release 3.5 are aimed at Computational Fluid Dynamics (CFD) researchers.
CFD is the numerical study of fluid flow, and is one of the most demanding
problem areas for visualisation. Enhancements for CFD in IRIS Explorer 3.5
include improved particle advection modules, new visualisation algorithms,
and improved support for irregular grids through pyramid modules.
CFD, along with Finite Element Analysis, is one of the most important sources
of irregular grids, often due to the demands of complex domain geometry.
Even when the computational grid is regular, data may be associated with
elements of higher dimensionality such as edges, faces and cells as well
as nodes. IRIS Explorer's pyramid datatype is specially designed to store
data of this variety, and new modules in Release 3.5 have been added to
enhance the processing and analysis of pyramid data. In addition, the range
of visualisation techniques has been expanded with new modules for display
of lattice (i.e. node-based) data.
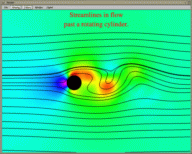
The particle advection modules NAGAdvectSimple and NAGAdvectAnimate provide particle tracking capabilities that are both powerful and easy
to use. Both modules make extensive use of NAG Library routines to ensure
both accuracy and efficiency. In addition, 'Smoke' visualisation of vector
fields has been added in IRIS Explorer 3.5 through the modules LatSmoke and MultiLatSmoke. These modules, originally developed at the Lawrence Livermore National
Laboratory, and enhanced in the new release by the incorporation of NAG
Library routines, generate smoke trails as tiny translucent tetrahedra,
and are particularly effective at visualising turbulent flow. Finally, the module StreamlinePyr has been added in Release 3.5 to provide particle tracking of vector fields
defined on pyramid grids. Once again, this module uses routines from the
NAG Library to generate accurate traces; an example of its use can be seen
in Figure 1.
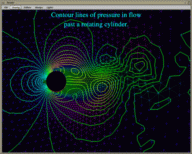
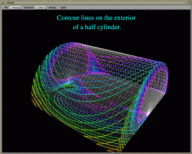
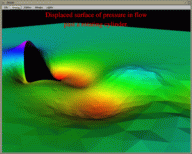 Other new pyramid modules that have appeared in IRIS Explorer 3.5 include ContourPyr and DisplacePyr. ContourPyr generates contour lines for nodal data across pyramid faces in two or three
dimensions. This can be used together with ExteriorPyr, which generates the outside of a pyramid (i.e. the set of unshared faces
or edges), to create contours on the outside faces of a pyramid structure
(see Figure 2 for an example). DisplacePyr uses the data part of a pyramid's base lattice to create a z component for its coordinates. Thus, it can be
used to construct displacement maps of 2D datasets on irregular grids, as
seen in Figure 3.
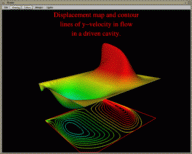 Other enhancements to the module suite include the addition of new functionality
to existing modules. For example, the PyrToGeom module can now be used to create geometry that is coloured according to
data stored in the pyramid at non-vertex levels - that is, data associated
with edges, faces or volumes. Thus, for example, it is now possible to directly
display the cell-based pressures calculated in CFDS-Flow3d without interpolating
to their values at the nodes.
 Many other enhancements in the new release (some of which have been described
in the article elsewhere in this issue) will be of benefit to CFD researchers. Finally,
data readers exist for many popular CFD data formats, such as Phoenics,
CFDS-Flow3d and Plot3d (both single and multi-block). Contact the IRIS Explorer Center to find out more about how you can turn your CFD
data into compelling displays using IRIS Explorer!
Last modified: Wed Jul 24 17:15:04 1996
[
Previous Article :
Render Home :
Next Article
]
© The Numerical Algorithms Group Ltd, Oxford UK. 1996
 Many of the new features that have been added to IRIS Explorer (External) in Release 3.5 are aimed at Computational Fluid Dynamics (CFD) researchers.
CFD is the numerical study of fluid flow, and is one of the most demanding
problem areas for visualisation. Enhancements for CFD in IRIS Explorer 3.5
include improved particle advection modules, new visualisation algorithms,
and improved support for irregular grids through pyramid modules.


