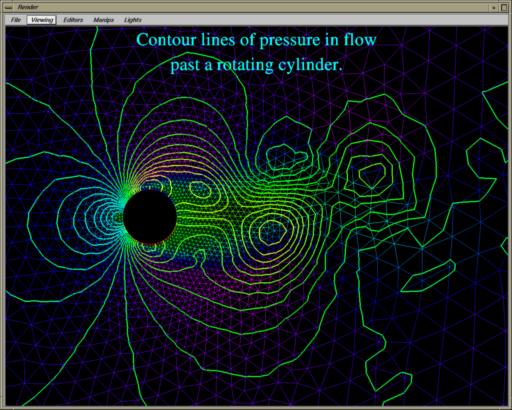
Figure 2. A contour map of pressure in flow past a rotating cylinder, created using ContourPyr, new in IRIS Explorer 3.5. PyrToGeom has been used to show the irregular structure of the grid; it is coloured according to x-velocity.