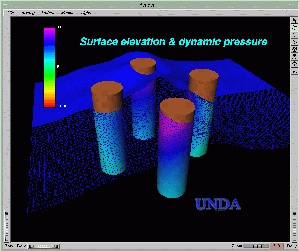
In the oil industry, numerical simulations have been important in studying wave motions around offshore structures. Particularly challenging is the calculation of wave forces on offshore installations induced by surface water waves. Simulations based on linear wave theory are insufficient for capturing some important nonlinear phenomena, which are of great importance for the design of offshore installations. A typical example is "ringing" which is vibration of the installation caused by rapidly changing wave loads. Aiming at new numerical methods for solving the system of nonlinear water wave equations [4], University of Oslo and SINTEF-Applied Mathematics have jointly initiated several research activities on these topics.
Through the development and application of the UNDA simulator, we have realised that such complicated computations and physical behaviour require good visualisation of the computated results. In UNDA simulations, static scene displays are no longer sufficient. Instead, users will rely heavily on high quality animations when investigating the evolution of different physical quantities over time. Such physical quantities of interest are e.g. water surface elevation and dynamic pressure on platform legs. Furthermore, animations enable the user to analyse some rapid changing processes during the simulation. It has been very important to us that we have easily achieved high quality results in IRIS Explorer. Animation loops involving our new modules have been successfully run on both SGI and HP machines. Video recordings of UNDA animations dumped from the Render module are also produced.
Typically, objects for visualisation are water surface elevation and dynamic pressure distribution on e.g. surfaces of platform legs. In fact, the data are nodal values on discrete grids calculated for a sequence of time levels. Since many time levels are usually involved in the calculation, we have decided to organize visualization data collectively. For example, we collect surface elevations on all time levels in a single data file, in this way avoiding having to handle a large number of smaller files.
Binary formats have been employed in these data files and the efficiency of data accessing from within IRIS Explorer can be secured by specially designed data import modules. Such a module typically takes a file name together with an integer counter indicating a specific time level, before generating standard IRIS Explorer data types as output. For flexibility, we let the import module for surface elevations produce directly a geometry object, i.e., a surface in 3D. The implementation also offers the user direct control over the drawing style of the surface - as a group of discrete 3D points, a grid mesh or a fully shaded surface. This approach allows the pressure distribution to be visible under the water surface. On the other hand, the associated import module for dynamic pressures simply generates a 2D curvilinear lattice with 3D coordinates, which is then passed to the LatToGeom module.
To help with the generation of animations, we have enhanced the For module to produce a new loop controller module called UNDAControl. Using this module, the user can stop the animation at any time level in order to investigate the scene in detail.
Another important practice in analysing nonlinear water waves is to study the water particle advection in the history of a simulation. Due to the nonlinearities, the track of a water particle is no longer the ellipse which is predicted by linear theories. Instead, interesting irregular movement patterns can be observed. Also as a useful means of code debugging, particles which are initially resting on the water surface can be monitored so to make sure that they always stay on the surface while never piercing into solid installations.
Numerically this can be achieved by solving a system of ordinary differential equations with a suitable numerical scheme. However, what makes the current case more complex than tracking particles in a stationary velocity field is that the UNDA velocity field is also time dependent.
We have therefore calculated the particle locations on all time levels for some chosen particles. These particles stay initially on the water surface (and will remain there during the whole simulation) and are close to platform legs. It is worth mentioning that the implementation uses Diffpack [2], a comprehensive C++ numerical library for solving differential equations. The object orientation feature of Diffpack is fully utilized when experimenting with different schemes so that the best tradeoff between accuracy and efficiency is found.

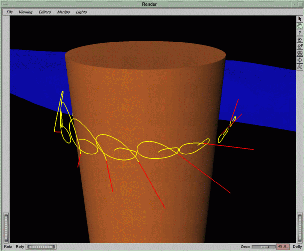
| A scene from the animation of streak lines around an offshore oil platform leg. The streaks come from a calculation of particle trajectories in the time-dependent velocity field. |
The path data for each particle are repsented by a history of locations and velocities. To create an animation of particle advections, we have developed a new IRIS Explorer module called PathDraw. On each time level a red arrow is drawn from the current position of a particle. In addition, a short history of the path over a certain number of previous time levels is displayed by a line segment in yellow. Again, the PathDraw module offers the user full flexibility so that both the magnitude of the velocity arrow and the length of the visible path are adjustable.
So far, we have kept the calculation and preparation of the data outside the visualization framework. This has been necessary because of the large size of the actual simulations. However, based on recent success on a priori work to incorporate medium sized Diffpack simulators into IRIS Explorer, we feel confident of producing in the future a flexible framework for interactive computation and visualisation inside IRIS Explorer for some practical problems.