This section describes how to invoke the debugger for thread-parallel (SMP) debugging and for process-parallel (MPI) debugging. It provides some important definitions and background information on how PGDBG represents processes and threads.
An active process is made up of one or more active threads of execution. In the context of a process-parallel program a process is an MPI process composed of one thread of execution. In the context of a thread-parallel program a thread is an OpenMP or Linux Pthread SMP thread. PGDBG is capable of debugging hybrid process-parallel/thread-parallel programs where the program employs multiple SMP processes.
PGDBG assigns a thread ID to each thread. PGDBG uses a thread's OpenMP ID when debugging an OpenMP program; zero based, incrementing in order of thread creation otherwise. Thread ID's are unique within the context of a single process only.
PGDBG assigns a process ID to each process. PGDBG uses a process' MPI rank (in communicator COMMWORLD) when debugging an MPI program; zero based, incrementing in order of process creation otherwise. Process ID's are unique across all active processes.
Each thread can be uniquely identified across all processes by prefixing its thread ID with the process ID of its parent process. For example thread 1.4 identifies the thread having thread ID 4 and the parent process having process ID 1.
An OpenMP program (thread-parallel only) logically runs as a collection of threads with a single process, process 0, as the parent process. In this context a thread is uniquely identified by its thread ID. The process ID prefix is implicit and optional. See Threads-only debugging.
An MPI program (non-SMP) logically runs as a collection of processes, each made up of a single thread of execution. Thread 0 is implicit to each MPI process. A Process ID uniquely identifies a particular process, and thread ID is implicit and optional. See Process-only debugging.
A hybrid, or multilevel MPI/OpenMP program requires the use of both process and thread IDs to uniquely identify a particular thread. See Multilevel debugging.
A serial program runs as a single thread of execution, thread 0, belonging to a single process, process 0. The use of thread IDs and process IDs is unnecessary but optional.
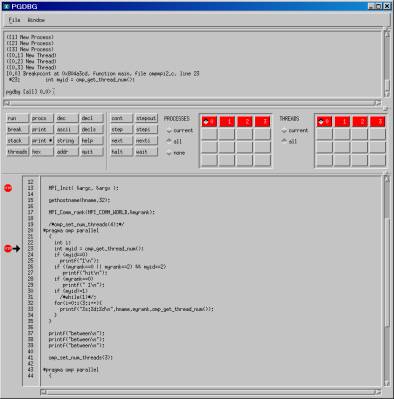
PGDBG automatically attaches to new threads as they are created during program execution. PGDBG describes when a new thread is created; The thread ID of each new thread is printed.
([1] New Thread)
The system ID of the freshly created thread is available through using the threads command. Use the procs command to display information about the parent process.
During a debug session, at any one time, PGDBG operates in the context of a single thread, the current thread. The current thread is chosen by using the thread command when the debugger is operating in text mode (invoked with the -text option), or by clicking in the thread grid when the GUI interface is in use (the default). See Thread Level Commands.
The threads command lists all threads currently employed by an active program. The threads command displays for each thread its unique thread ID, system ID (Linux process ID), execution state (running, stopped, signaled, exited, or killed), signal information and reason for stopping, and the current location (if stopped or signaled). The arrow indicates the current thread. The process ID of the parent is printed in the top left corner.
List Active Threads : threads
pgdbg [all] 2> threads
0  ID PID    STATE      SIGNAL      LOCATION
   3  18399  Stopped    SIGTRAP     main line: 31 in "omp.c" address: 0x80490ab
=> 2  18398  Stopped    SIGTRAP     main line: 32 in "omp.c" address: 0x80490cf
   1  18397  Stopped    SIGTRAP     main line: 31 in "omp.c" address: 0x80490ab
   0  18395  Stopped    SIGTRAP     f line: 5 in "omp.c" address: 0x8048fa0
Change Current Thread : thread
pgdbg [all] 2> thread 3
pgdbg [all] 3> threads
0   ID PID    STATE      SIGNAL      LOCATION
=> 3  18399  Stopped    SIGTRAP     main line: 31 in "omp.c" address: 0x80490ab
   2  18398  Stopped    SIGTRAP     main line: 32 in "omp.c" address: 0x80490cf
   1  18397  Stopped    SIGTRAP     main line: 31 in "omp.c" address: 0x80490ab
   0  18395  Stopped    SIGTRAP     f line: 5 in "omp.c" address: 0x8048fa0
GUI mode:
	% pgdbg <executable> <args>,...<args>
TEXT mode:
	% pgdbg -text <executable> <args>,...<args>
The PGDBG Graphical User Interface (GUI) lists all active threads in a thread grid. Each element of the thread grid is labeled with a thread ID and represents a single thread. Each element is a button that can be pushed to select a particular thread as the current thread. The PGDBG GUI displays the program context of the current thread.
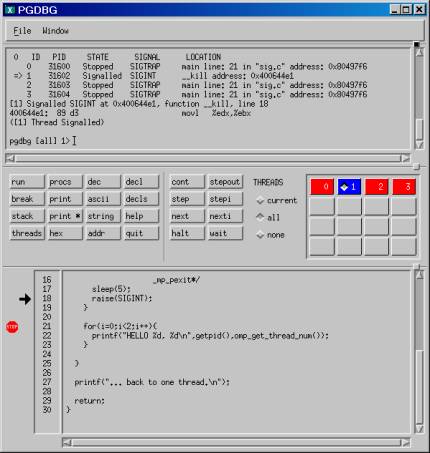
Each button in the thread grid is color coded to depict the execution state of the underlying thread.
State |
Color |
Stopped |
Red |
Signaled |
Blue |
Running |
Green |
Exited |
Black |
Killed |
Black |
PGDBG automatically attaches to new MPI processes as they are created by a running MPI program. PGDBG must be invoked via the MPIRUN script. The MPIRUN -dbg option is used to specify which debugger to use. To choose PGDBG use -dbg=pgdbg before the executable name (this is not a program argument). PGDBG must be installed on your system and your PGI environment variable set appropriately, and added to your PATH.
PGDBG displays an informational message as it attaches to the freshly created processes.
Example:
([1] New Process)
The MPI global rank is printed with the message. Use the procs command to list the host and the PID of each process by rank.
Example:
pgdbg [all] 0> procs
    ID   IPID   STATE      THREADS   HOST
 => 0    29316  Stopped    1         red1
    1    10687  Stopped    1         red2
During a debug session, at any one time, PGDBG operates in the context of a single process, the current process. Each active process has a thread set of size >=1. The current thread is a member of the thread set of the current process.
Distributed with PGDBG is a license file that restricts PGDBG to debugging a total of 64 threads. Workstation and CDK license files may further restrict the number of threads that PGDBG is eligible to debug. PGDBG will use the Workstation or CDK license files to determine the number of threads it is able to debug.
Example:
With its 64 thread limit PGDBG is capable of debugging a 16 node cluster with 4 CPUs on each node or a 32 node cluster with 2 CPUs on each node or any combination of threads that add up to 64.
Use the proc command to change the current process. Those PGDBG commands that refer to program scope execute off of the current scope of the current thread by default The current thread must be stopped in order to read from its memory space. See Thread Level Commands for a description and list of these context sensitive commands.
To list all active processes use the procs command. The procs command lists all active processes by process ID (MPI rank where applicable). Listed for each process: the system ID of the initial thread, process execution state, number of active threads, and host name. The initial process is run locally; `local' describes the host the debugger is running on. The execution state of a process is described in terms of the execution state of its component threads:
Process state |
Description |
Color |
Stopped |
If all threads are stopped at breakpoints, or where directed to stop by PGDBG |
Red |
Signaled |
If at least one thread is stopped on an interesting signal (as described by catch) |
Blue |
Running |
If at least one thread is running |
Green |
Exited or Killed |
If all threads have been killed or exited |
Black |
List Active Processes : procs
pgdbg [all] 0.0> procs
    ID   IPID   STATE      THREADS   HOST
 => 0    24765  Stopped    1         local
    1    17890  Stopped    1       red2.wil.st.com
To change the current process by process ID, use the proc command. The current process is marked with an arrow.
Set Current Process : proc
pgdbg [all] 0.0> proc 1; procs
Process 1: Thread 0 Stopped at 0x804a0e2, function main, file mpi.c, line 30
 #30:       aft=time(&aft);
    ID   IPID   STATE      THREADS   HOST
    0    24765  Stopped    1         local
 => 1    17890  Stopped    1       red2.wil.st.com
pgdbg [all] 1.0>
The prompt displays the current process and the current thread. The current process above has been changed to process 1, and the current thread of process 1 is 0. This is written as 1.0. See The PGDBG Command Prompt for a complete description of the prompt format.
To debug an MPI program, PGDBG is invoked via MPIRUN. MPIRUN sets a breakpoint at main and starts the program running under the control of PGDBG. When the initial process hits main no other MPI processes are active. The non-initial MPI processes are created off of MPI_Init.
A Fortran MPI program stops at main initially instead of MAIN. You must step into MAIN.
GUI mode:
% mpirun -np 4 -dbg=pgdbg <executable> <args>,...<args>
TEXT mode:
% unsetenv DISPLAY
% mpirun -np 4 -dbg=pgdbg <executable> <args>,...<args>
An MPI debug session starts with the initial process stopped at main. Set a breakpoint at a program location after the return of MPI_Init to stop all processes there. If debugging Fortran, step into the MAIN program.
PGDBG supports redirecting stdin, stdout, and stderr with the following MPI-CH switches:
-stdout <file> |
Redirect standard output to <file> |
-stdin <file> |
Redirect standard input from <file> |
-stederr <file> |
Redirect standard error to <file> |
PGDBG also provides support for the following MPI-CH switches:
-nolocal |
PGDBG runs locally, but no MPI processes run locally |
-all-local |
PGDBG runs locally, all MPI processes run locally |
If you are using your own version of MPI-CH, see our online FAQ for how to integrate the MPIRUN scripts with PGDBG.
When PGDBG is invoked via MPIRUN the following PGDBG command line arguments are not accessible. A possible workaround is listed for each.
-dbx |
Include 'pgienv dbx on' in .pgdbgrc file |
-s startup |
Use .pgdbgrc default script file and the script command. |
-c "command" |
Use .pgdbgrc default script file and the script command. |
-text |
Clear your DISPLAY environment variable before invoking MPIRUN |
The PGDBG GUI lists all active processes in a process grid. Each element of the process grid is labeled with a process ID and represents a single process. Each element is a button that can be pushed to select a particular process as the current process. A diamond indicates the current process. The thread grid depicts the threads of the current process. When the current process is changed, the thread grid is refreshed to describe the threads of the (new) current process, and the current thread is set to be the current thread of that process. PGDBG displays the program context of the current thread (source position, registers, disassembly etc.).