The Intel® C++ Compiler Code-coverage Tool can be used for both IA-32 and Itanium® architectures in a number of ways to improve development efficiency, reduce defects, and increase application performance. The major features of the Intel compiler Code-coverage Tool are:
The syntax for this tool is as follows:
codecov [-codecov_option]
where -codecov_option is a tool option. If you do not use any option, the tool will provide the top-level code coverage for your whole program.
The tool uses options that are listed in the table that follows.
| Option | Description | Default |
|---|---|---|
| -help | Prints all the options of the code-coverage tool. | |
| -spi file | Sets the path name of the static profile information file .spi. | pgopti.spi |
| -dpi file | Sets the path name of the dynamic profile information file .dpi. | pgopti.dpi |
| -prj | Sets the project name. | |
| -counts | Generates dynamic execution counts. | |
| -nopartial | Treats partially covered code as fully covered code. | |
| -comp | Sets the filename that contains the list of files of interest. | |
| -ref | Finds the differential coverage with respect to ref_dpi_file. | |
| -demang | Demangles both function names and their arguments. | |
| -mname | Sets the name of the web-page owner. | |
| -maddr | Sets the email address of the web-page owner. | |
| -bcolor | Sets the html color name or code of the uncovered blocks. | #ffff99 |
| -fcolor | Sets the html color name or code of the uncovered functions. | #ffcccc |
| -pcolor | Sets the html color name or code of the partially covered code. | #fafad2 |
| -ccolor | Sets the html color name or code of the covered code. | #ffffff |
| -ucolor | Sets the html color name or code of the unknown code. | #ffffff |
Based on the profile information collected from running the instrumented binaries when testing an application, the Intel compiler creates HTML files using a code-coverage tool. These HTML files indicate portions of the source code that were or were not exercised by the tests. When applied to the profile of the performance workloads, the code-coverage information shows how well the training workload covers the application's critical code. High coverage of performance-critical modules is essential to taking full advantage of profile-guided optimizations.
The code-coverage tool can create two levels of coverage:
The top-level coverage reports the overall code coverage of the modules that were selected. The following options are provided:
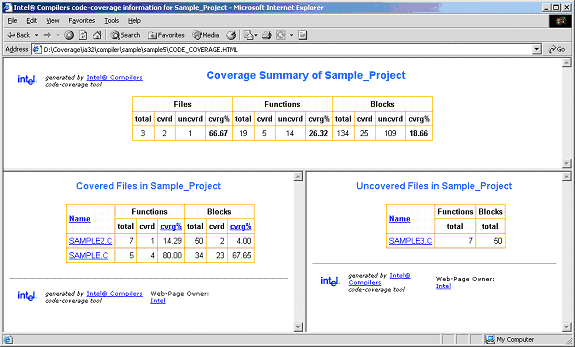
The example that follows shows a top-level coverage summary for a project. By clicking on a module name (for example, SAMPLE.C), the browser will display the coverage source view of that particular module.

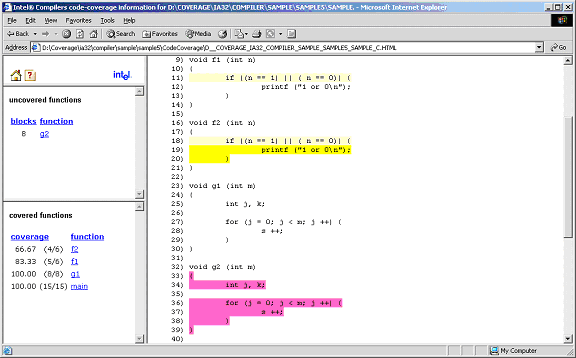
The coverage tool creates frames that facilitate browsing through the code to identify uncovered code. The top frame displays the list of uncovered functions while the bottom frame displays the list of covered functions. For uncovered functions, the total number of basic blocks of each function is also displayed. For covered functions, both the total number of blocks and the number of covered blocks as well as their ratio (that is, the coverage rate) are displayed.
For example, 66.67(4/6) indicates that four out of the six blocks of the corresponding function were covered. The block coverage rate of that function is thus 66.67%. These lists can be sorted based on the coverage rate, number of blocks, or function names. Function names are linked to the position in source view where the function body starts. So, just by one click, the user can see the least-covered function in the list and by another click the browser displays the body of the function. The user can then scroll down in the source view and browse through the function body.
Within the individual module source views, the tool provides the list of uncovered functions as well as the list of covered functions. The lists are reported in two distinct frames that provide easy navigation of the source code. The lists can be sorted based on:
This example shows the coverage source view of SAMPLE.C.

The tool provides a visible coloring distinction of the following coverage categories:
The default colors that the tool uses for presenting the coverage information are shown in the tables that follows.
| This color | Means |
|---|---|
| Covered code | The portion of code colored in this color was exercised by the tests. The default color can be overridden with the -ccolor option. |
| Uncovered basic block | Basic blocks that are colored in this color were not exercised by any of the tests. They were, however, within functions that were executed during the tests. The default color can be overridden with the -bcolor option. |
| Uncovered function | Functions that are colored in this color were never called during the tests. The default color can be overridden with the -fcolor option. |
| Partially covered code | More than one basic block was generated for the code at this position. Some of the blocks were covered while some were not. The default color can be overridden with the -pcolor option. |
| Unknown | No code was generated for this source line. Most probably, the source at this position is a comment, a header-file inclusion, or a variable declaration. The default color can be overridden with the -ucolor option. |
The default colors can be customized to be any valid HTML color by using the options mentioned for each coverage category in the table above.
For code-coverage colored presentation, the coverage tool uses the following heuristic. Source characters are scanned until reaching a position in the source that is indicated by the profile information as the beginning of a basic block. If the profile information for that basic block indicates that a coverage category changes, then the tool changes the color corresponding to the coverage condition of that portion of the code, and the coverage tool inserts the appropriate color change in the HTML files.
 Note
Note
You need to interpret the colors in the context of the code. For instance, comment lines that follow a basic block that was never executed would be colored in the same color as the uncovered blocks. Another example is the closing brackets in C/C++ applications.
One of the capabilities of the Intel compiler Code-coverage Tool is efficient coverage analysis of an application' s subset of modules. This analysis is accomplished based on the selected option -comp of the tool's execution.
You can generate the profile information for the whole application, or a subset of it, and then divide the covered modules into different components and use the coverage tool to obtain the coverage information of each individual component. If only a subset of the application modules is compiled with the -prof_genx option, then the coverage information is generated only for those modules that are involved with this compiler option, thus avoiding the overhead incurred for profile generation of other modules.
To specify the modules of interest, use the tool's -comp option. This option takes the name of a file as its argument. That file must be a text file that includes the name of modules or directories you would like to analyze:
codecov -prj Project_Name -comp component1
 Note
Note
Each line of the component file should include one, and only one, module name.
Any module of the application whose full path name has an occurrence of any of the names in the component file will be selected for coverage analysis. For example, if a line of file component1 in the above example contains mod1.cpp, then all modules in the application that have such a name will be selected. The user can specify a particular module by giving more specific path information. For instance, if the line contains /cmp1/mod1.cpp, then only those modules with the name mod1.cpp will be selected that are in a directory named cmp1. If no component file is specified, then all files that have been compiled with -prof_genx are selected for coverage analysis.
This feature displays the dynamic execution count of each basic block of the application, providing useful information for both coverage and performance tuning.
The coverage tool can be configured to generate information about dynamic execution counts. This configuration requires the -counts option. The counts information is displayed under the code after a ^ sign precisely under the source position where the corresponding basic block begins. If more than one basic block is generated for the code at a source position (macros, for example), then the total number of such blocks and the number of the blocks that were executed are also displayed in front of the execution count.
In certain situations, it may be desirable to consider all the blocks generated for a single source position as one entity. In such cases, it is necessary to assume that all blocks generated for one source position are covered when at least one of the blocks is covered. This assumption can be configured with the -nopartial option. When this option is specified, decision coverage is disabled, and the related statistics are adjusted accordingly. The code lines 11 and 12 indicate that the printf statement in line 12 was covered. However, only one of the conditions in line 11 was ever true. With the -nopartial option, the tool treats the partially covered code (like the code on line 11) as covered.
Using the code-coverage tool, you can compare the profiles of the application's two runs: a reference run and a new run identifying the code that is covered by the new run but not covered by the reference run. This feature can be used to find the portion of the application’s code that is not covered by the application’s tests but is executed when the application is run by a customer. It can also be used to find the incremental coverage impact of newly added tests to an application’s test space.
The dynamic profile information of the reference run for differential coverage is specified by the -ref option, such as in the following command:
codecov -prj Project_Name -dpi customer.dpi -ref appTests.dpi
The coverage statistics of a differential-coverage run shows the percentage of the code that was exercised on a new run but was missed in the reference run. In such cases, the coverage tool shows only the modules that included the code that was uncovered.
The coloring scheme in the source views also should be interpreted accordingly. The code that has the same coverage property (covered or not covered) on both runs is considered as covered code. Otherwise, if the new run indicates that the code was executed while in the reference run the code was not executed, then the code is treated as uncovered. On the other hand, if the code is covered in the reference run but not covered in the new run, the differential-coverage source view shows the code as covered.
To run the Intel compiler Code-coverage Tool for differential coverage, the following files are required:
Once the required files are available, the coverage tool may be launched from this command line:
codecov -prj Project_Name -spi pgopti.spi -dpi pgopti.dpi
The -spi and -dpi options specify the paths to the corresponding files.
The Code-coverage Tool also has the following additional options for generating a link at the bottom of each HTML page to send an electronic message to a named contact by using -mname and -maddr options.
codecov -prj Project_Name -mname John_Smith -maddr js@company.com