Exercise Four


Previous : Contents

Objectives

To read in some simple data and visualise it.

Instructions

  1. Launch the ReadLat module and use it to read in the 2D height field data file. Launch Contour and Render, and connect the modules together. Experiment with the contour levels. What other techniques could be used to display this type of data?
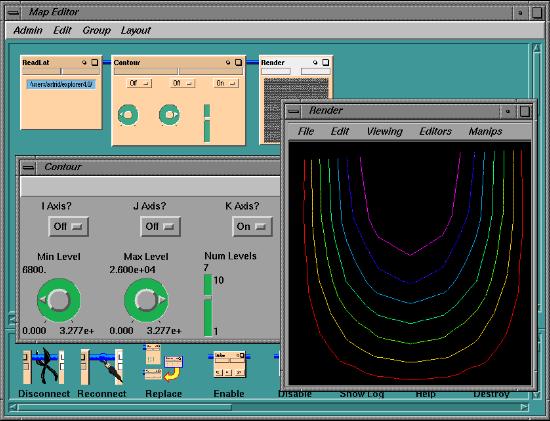
  2. Figure Ex4.1: The 2D Height Field Data contour map

  3. Delete the Contour module, and launch the VectorDisplay and BoundBox modules. Use ReadLat to read in the 3D velocity field data file. Connect the modules up, and experiment with the VectorDisplay parameters to produce different visualisations of the velocity. Next, try using NAGAdvectSimple to generate a streamline through the data.
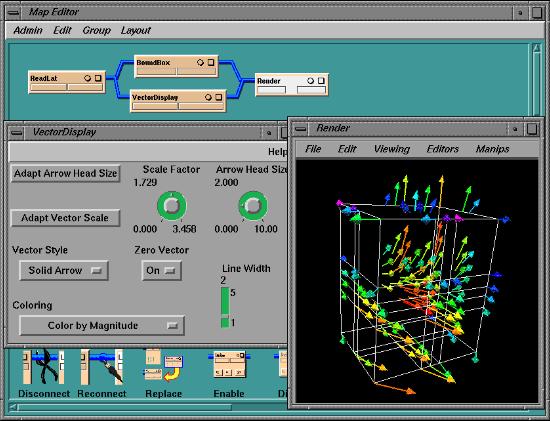
  4. Figure Ex4.2: The 2D Height Field Data vector field map

  5. Delete VectorDisplay and BoundBox, and launch GenerateColormap and Ball. Use ReadLat to read in the 3D particle trajectory data file. Connect the output of ReadLat to the Data In port of GenerateColormap to create a colormap which corresponds to the range of data in the lattice. Set Output? to Run to output the updated colormap. Pass the colormap to the Ball module. In Ball, set radius style to fixed radius. Experiment with the scaling factor for the ball radius.
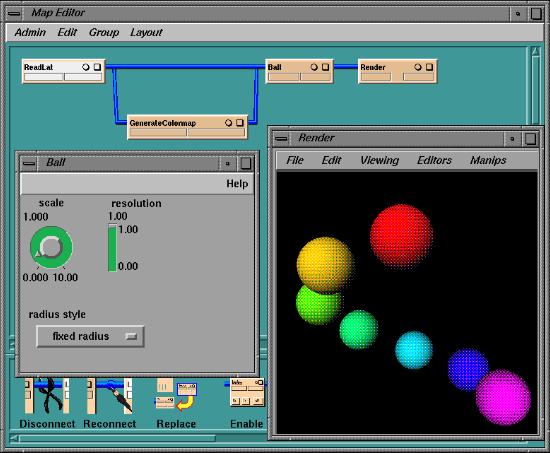
  6. Figure Ex4.3: The 2D Height Field Data spheres map


    Previous : Contents
    © The Numerical Algorithms Group Ltd. Oxford, UK. 1999