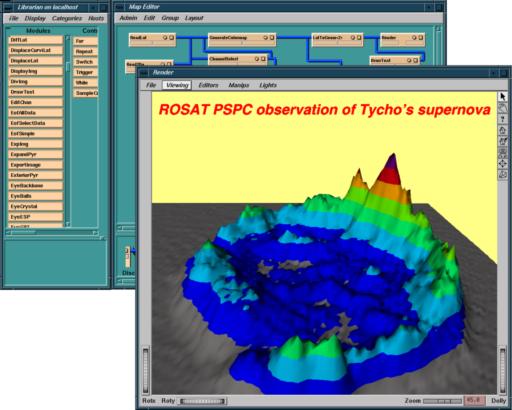
Visualising a 2D data set as a coloured sheet, using the new version of LatToGeom in Release 3.5 of IRIS Explorer. Solid contours of the data values have been added to the surface. In this case, the contoured data and the data used to create the sheet geometry are the same, but this doesn't have to be the case, which makes this a useful technique for exploring relationships between two sets of 2D data. The image comes from an observation of Tycho's supernova using a Position Sensitive Proportional Counter on board the ROSAT satellite; the dataset is the intensity count in the 0.1-2.4 keV X-ray energy range.