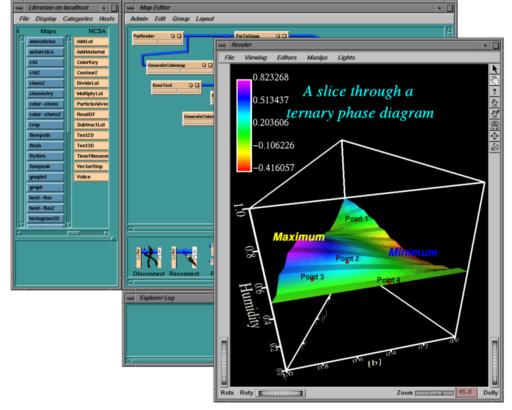
Viewing a slice through a ternary phase diagram in IRIS Explorer 3.5. The lower axes measure concentration of the three components in the system, while humidity is plotted on the upper axis. The colours and shape of the surface illustrate the phase changes in the system. The data are calculated on a triangular mesh, and read into the map as a pyramid. The new Annotation module is used to label locations on the surface; note the different fonts, sizes and colours used for the labels. Annotation can also be used to add lines and arrows to the scene, as well as providing full control over the editing of these components.