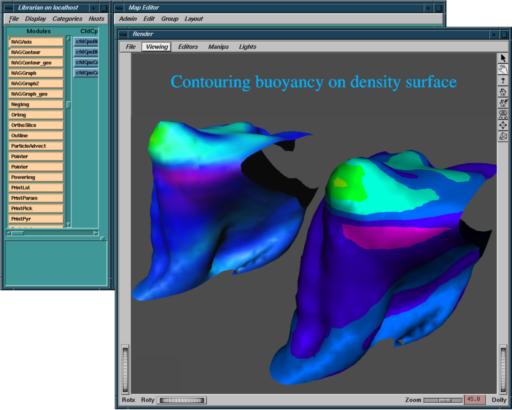
Using the new version of IsosurfaceLat in IRIS Explorer 3.5 to create an isosurface of constant density, coloured according to the local value of buoyancy. Two methods of colouring the surface (produced by two copies of IsosurfaceLat) are illustrated in the window of the Render module. On the left, the data are used to colour the vertices, and the colours are then smoothly interpolated between points on the surface. On the right, which is a new method in Release 3.5, the data values are used to create solid coloured contours on the surface. The user has control over the number of contours to be used, as well as the colourmap. The dataset comes from the numerical simulation of a thunderstorm.