Acknowledgements
Work undertaken by The
Numerical Algorithms Group Ltd
Oxford, UK
(by Astrid van Maanen).
New NAGGraph
- Displays y(x) as line/marker plot
- Axes labels, annotation, legend
- Support for multiple data variables
- Hershey fonts used for labelling
- Support for in-string keywords, e.g !gG!d0n
- PostScript output
- Geometry output - can be displayed in Render - New!
New NAGContour
- Displays z(x,y) as contour plot
- Axes labels, annotation, legend
- z values can be
-
- on a regular grid, or
-
- scattered over the domain
- PostScript output
- Geometry output - can be displayed in Render - New!
NAGAxis - New!
- Creates axes for 1D, 2D or 3D lattice
- Automatic placement of labels, or can be user-specified according to
-
- number of intervals, or
-
- interval size
- Automatic placing of each axis origin, or can be user-specified
- Each axis can be toggled on & off
- Open Inventor text used for labels
TransformGeom - New!
- Transforms any geometry
-
- Translation
-
- Scaling
-
- Rotation about x, y or z axis
-
- Rotation about arbitrary axis
Examples
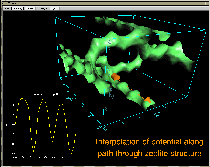
3D interpolation
- 3D atomic potential energy in a zeolite
- Displayed using IsosurfaceLat
- NAGAxis used to display extent of data
- Ruler used to interpolate potential along path in 3D
- NAGGraph plots potential vs. distance and passes it to Render for display

2D interpolation
- Concentration as function of distance and time
- NAGAxis displays extent of data
- Ruler used to extract concentration profile at a particular time
- NAGGraph plots concentration vs. distance and passes it to Render for display
- DrawText creates dynamic caption

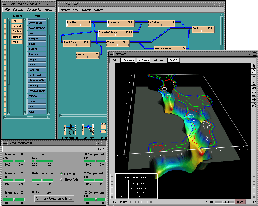
Combining geometries
- 2D atomic potential energy in a zeolite
- Displayed using LatToGeom and NAGContour
- TransformGeom used to shift contour plot in z direction before Render displays it
- Key from contour plot passed to Render's Screen input port for display in 2D plane

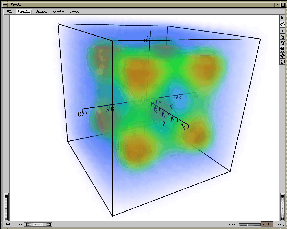
Symmetry in the data
- 3D values from Chebychev polynomials
- Displayed using VolumeToGeom
- NAGAxis displays extent of data
-
- various choices for label spacing
-
- origin of axes shifted to centre of box, to highlight data's symmetry in each octant

Last modified: Mon Aug 5 14:50:23 1996
[ Posters Home ]
© The Numerical Algorithms Group Ltd, Oxford UK, 1996.


