NIH Researcher Creates Anatomic Visualization for Noninvasive 3D
Bronchial Fly-Throughs
Ronald M. Summers, National
Institutes of Health, Bethesda, Maryland
Aided by powerful and flexible computer visualization software, a
diagnostic radiologist at the National Institutes of Health,
Bethesda, Maryland, is pioneering completely non-invasive human
bronchial tree inspection that requires only a few minutes of patient
involvement.
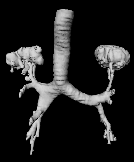
 With a technique he calls virtual bronchoscopy, Ronald M. Summers,
M.D., Ph.D., in the NIH Diagnostic Radiology Department, uses
computerized tomography (CT) and computer software to create
extremely accurate 3D images of patients' bronchial structures,
then analyzes them with a fly-through technique.
With degrees in physics and medicine from the University of Pennsylvania,
Dr. Summers completed a radiology residency program at the University
of Michigan, then went to Duke University where he began to study
computerized 3D imaging and visualization techniques.
"During that time," he says, "I was using software to fly through
3D models of different structures of the body. When I came to NIH
as a diagnostic radiologist, I began to use IRIS Explorer and a
Silicon Graphics computer. Then I started a program to make
computerized models."
Dr. Summers' workstation is an SGI Indigo 2 Extreme with 320
megabytes of RAM and a nine gigabyte hard drive running IRIS
Explorer(TM) 3.0, the interactive 3D data visualization system from
the Numerical Algorithms Group (NAG), Inc., Downers Grove, Illinois.
CT and MRI scanners in his department are routinely used for
diagnostic studies. At the present time, for example, Dr. Summers
and an associate are studying patients with homozygous familial
hypercholesterolemia, using MRI to research the development of
atherosclerosis in those patients. Another study involves juvenile
dermatomyositis, an inflammatory condition of the muscles, and MRI
is assisting in the evaluation of abnormalities in the muscles of
affected children.
As the primary collectors of data for computerized visualization,
their MRI and CT scanners are linked to the Internet where the
output is transmitted to Dr. Summers' workstation. The datasets
containing scans range from 70 to 120 megabytes in size.
"I transfer them over our network to the SGI computer," Dr. Summers
explains. "Then I strip the header information and generate a 3D
uniform lattice to use as IRIS Explorer input. From there, I use
a module I wrote for IE that does a region-growing algorithm, a
technique in image processing. In brief, I say that a voxel (volume
element) in the dataset is my seed, and then I let the region-growing
algorithm aggregate adjacent data elements (voxels) in the image."
 "In my method," Dr. Summers says, "I use a CT dataset of a patient's
chest -- perhaps 70 megabytes of data, and it includes multiple cross
sections through the imaging area stacked vertically. Each data
element in the set consists of the density of the tissue in one very
tiny area of the patient. Thus, the 70 megabyte set specifies and
includes the density of the tissue at millions of voxels in that
patient."
"Then I pick one voxel inside the airway, and I ask the
software to aggregate all the voxels that connect to the
original one that also are filled with air. That algorithm
spreads out through the patient looking for little bits of air
in the lungs. When it's done, it has the bronchial tree."
At this point, Dr. Summers sends the data through IRIS Explorer's
IsoSurfaceLat module. An isosurface is a surface of constant
value in a 3D field. IsoSurfaceLat calculates an isosurface
of a scalar 3D lattice. The algorithm used takes edge
intersections and knits them into triangle meshes -- usually
between 100,000 and 250,000 triangles -- for rendering. This
procedure generates a 3D visualization of the surface of the
bronchial wall which Dr. Summers then sends to IE's Render
module.
The Render module displays geometry data. It is built using
the Inventor SceneViewer which allows a large number of
different viewing paradigms. There are two major modes in
Render -- viewing and selection/picking. In viewing mode,
the camera parameters can be changed, and users can toggle
between a perspective and an orthographic view. Other features
include a Walk viewer for a walk-through allowing motion and
a camera pointed with constant eye level, a Plane viewer that
lets the user manipulate the camera with respect to the viewing
plane, and a Fly viewer that simulates constrained flight
through space.
"With this 3D model and the Fly viewer," he continues, "I can
move around and look for lesions of the bronchial wall. I also
look for areas of narrowing, and I can make measurements of
bronchial size. This computerized method allows us to make
exact lesion measurements. The measurements cannot be made
accurately with the bronchoscope used in standard procedures
because of its wide-angle lens."
This procedure has many other advantages," Dr. Summers
emphasizes. "We're simply doing a CT scan; no sedation is
necessary. The patient just holds his or her breath for 15-20
seconds twice."
Dr. Summers uses a number of IRIS Explorer modules in his work.
One is OrthoSlice, a module that extracts a 2D lattice from a
3D lattice in index space. Others include AnimateCamera and
WriteMovie, both of which he connects to Render to make movies
of fly-throughs.
"I have video capability through my Indigo2 video collaboration
option, and a VCR connected to my workstation. As I'm flying
around, I can record it on standard VHS videotape. Quite often,
I make slides with the DisplayImage module and the WriteImage
module using SGI format, then import them into the SGI Showcase
presentation package. Then I can generate 35mm slides for
presentations. I've also done fly-throughs of the aorta in the
patients with homozygous familial hypercholesterolemia, and
I've visualized a beating human heart."
No endorsement of any organization, product or service mentioned in
this article is intended by the National Institutes of Health or
its employees, or should be inferred.
Last modified: Thu Jan 16 14:17:27 1997
[ Posters Home ]
© The Numerical Algorithms Group Ltd, Oxford UK, 1996.
 With a technique he calls virtual bronchoscopy, Ronald M. Summers,
M.D., Ph.D., in the NIH Diagnostic Radiology Department, uses
computerized tomography (CT) and computer software to create
extremely accurate 3D images of patients' bronchial structures,
then analyzes them with a fly-through technique.
