Acknowledgements
Some new IRIS Explorer modules developed by
Jeremy Walton at
The Numerical Algorithms Group Ltd (NAG),
Oxford, UK and
Hiro Chiba at
IRIS Explorer Center Japan (IECJ),
Tokyo, Japan
DrawText
- Creates text for annotation
- Formatting of parameter values in string
- in fixed point or exponential form
- control over no. of significant digits
- Choice of fonts, sizes, colours
- Location controlled by widgets
Example: quantum chemistry

- High potential Iron Protein
- Calculation of wavefunction, Y(x,y,z)
- MultiplyLat yields Y2 - electron density
- Y2 displayed as isosurface
- coloured by (sign of) Y
- Parameters passed to DrawText,
caption updates as values change
Data courtesy of Louis Noodleman and David Case, Scripps Clinic, La Jolla
Outline
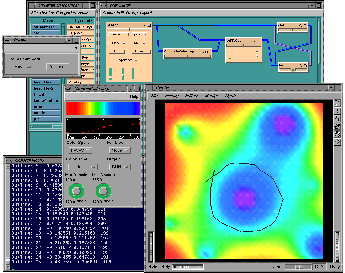
- Selects points in 2D lattice
- Points joined by polyline
- Interpolates to find data values at points
- User specifies points by picking
- Can add, move, delete points
- Outputs
- geometry of polyline
- details of point coords & data values
Example: feature outlining

- Toy data from GenLat
- Displayed using LatToGeom
- Outline used to pick out feature
- Outputs point coords & data values
- Could be extended to ROI calculations
- area of ROI
- average values over ROI
ReadQM
- Reads in simple molecular data
- Format
- list of atomic coords and types
- bonding information
- Bonds can be
- explicit list
- to be calculated from distance criteria
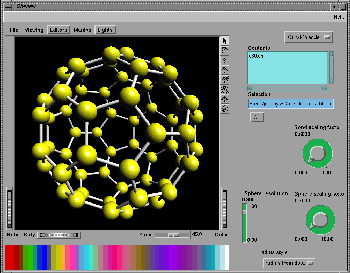
Example: application building

- Buckminsterfullerene, C60
- ReadQM
- reads in coords and types
- calculates bonds
- Atoms displayed using Ball, bonds with
Sticks (from NAG)
- Discrete colourmap for atomic types
- Useful widgets put into control panel
Last modified: Mon Aug 5 14:50:21 1996
[ Posters Home ]
© The Numerical Algorithms Group Ltd, Oxford UK, 1996.


